| Home • Forum • RSS • PGP • Alerts • Links • (D) |
|
|
|
|
Performance Monitoring in Delphi Comment on this article
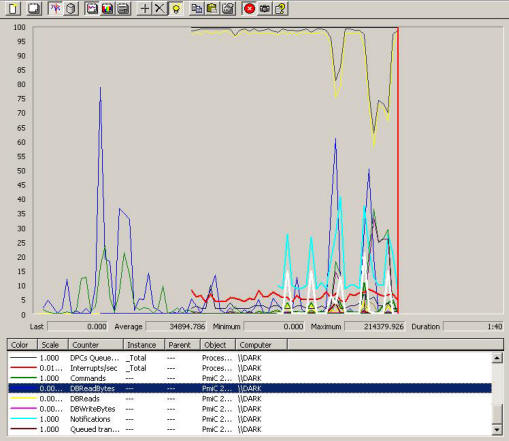
The performance monitor in Windows NT, 2000 and XP is a primary tool to help you tune and profile applications and systems and is much under-used. I know, since I’ve been a very active under-user of that system for years. But now I got religion and in a flash of insight I saw the use of it, namely to check in the innards of my own apps. So, what can you do with performance monitoring, actually? Well, you can watch pretty pictures such as this one:
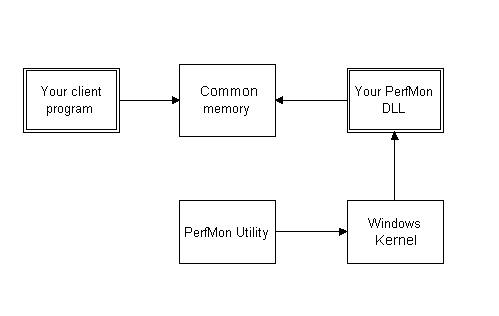
In this graph you see second-by-second measurements of vital statistics about the system and about my application, a communication client I’m developing. In heavy white, you see the currently selected counter (DBReadBytes), which makes it easier to untangle this apparent mess. Instead of a graph, you can record all data to performance logs to be analyzed later, or you can present them as histograms. You can also connect to performance counters on other machines on the net, and so on. The performance monitor is a veritable garden of delight for the average hacker, but I’ll leave it up to you to explore it fully. My task is different; I need to tell you how to have your own Delphi app output data to the performance monitor, and that is what this article is all about. Before jumping in, I will tell you what I left out: instance counters and other types than cardinals. I don’t think you will miss either one, though. What I did implement covers everything most applications will ever need and if you need more, at least you got a good start.Documentation and examples The documentation and examples about this technique are in a sorry state. MSDN is totally misleading, while the SDK documentation is largely lacking. MSDN tells you to use some kind of COM object wrappers for this thing, but I couldn’t find them anywhere. Just as well, since there is a knowledgebase article telling us COM can’t be used in these scenarios, which probably explains why the MSDN objects don’t exist. The only book that turned out to be actually useful was “Programming Server-Side Applications for Microsoft Windows 2000” by Jeffrey Richter and Jason D. Clark. It’s not totally correct, but it’s close and it gets you there. As seen from three planets away If we take a very high level view of how performance monitoring works, it looks something like this:
There are a few salient points to be made about the diagram:
Shared memory or COM? It would seem as if COM would be a pretty good choice for the communication between your client program and your PerfMon DLL, but that is not the case. The reason is that your DLL gets called on a thread belonging to the Windows kernel and that thread may not allow COM activity. In particular, CoInitialize() will fail at least some of the time. So forget COM, and totally disregard the MSDN examples of how to use COM in this scenario. They don’t work.Shared memory is a much better idea and the way to accomplish this is by using so called “Memory Mapped Files”. Not only is it efficient and solves the problem, it’s also incredibly simple to use. That is a rare, but welcome, combination of attributes. First thing - memory mapped file handler Let’s start with the easiest part to implement. This is also the part that does not need any of the other units to work. Two programs that communicate using common memory keep the same mapped file open at the same time, so that is what our client program and our DLL will do. The party that comes first gets the honor of creating the file, the next party opens an existing file. Once both parties close their handles, the file is removed automatically by Windows.You may think there’s a contention problem in simultaneously reading and writing to the same file from two different processes, and you would be right. Normally (if there is such a thing in computing), you would protect access to the file with a named mutex, since named mutexes can be shared between processes. In this particular case, however, it’s not worth bothering with. If, by chance, a particular measurement data point would be corrupted by simultaneous access, it would cause a spike in the performance monitoring graph, which would be so obviously wrong and shortlived that the observer would not have trouble seeing it for a false reading. It would also be rare; I’ve never seen one so far. Additionally, having each access protected with a mutex would have a significant impact on the performance of both the client and the performance monitoring system, and we certainly don’t want that. So, getting down to it, how do you create and use memory mapped files? Well, first you have to decide on a name, and I’m leaving that up to the definition module we’ll talk about later. Since both processes use the same definition module, this guarantees that both sides of the communication use the same name.You first create a file mapping using
the In general, a lot of different data types can be used in performance monitoring, but I limited myself to only cardinal types (32 bit unsigned integers), so the mapped file needs only to be able to handle DWORD values. The entire memory mapped class is given here. The Client Data Definition unit You need to have a place somewhere to define the counters you are going to use. They need to have a name and a short text describing what they’re for. You also need to define the type of counter you want to use. Since both your client application and the DLL need some of this information, it’s best to define all this in one unit that gets used from both the client application and the DLL. See listing for the complete unit as it looks in the sample application. This shared unit could just contain a whole series of constants, but that’s ugly and inflexible. Much better is to make it into a singleton object. The pattern I use in these circumstances is a singleton object with an interface defined in a separate unit. This way several callers can use the interface and several application definition units can implement it without too much confusion of machines and programmers. A hairy little problem occurs, though. An interface in Delphi is reference counted in principle. If you’ve got a singleton object, this is bothersome and should be neutralized by stubbing out the reference counting functions _AddRef() and _Release(), which I dutifully do. The variables holding references to an interface will, by compiler magic, make calls to _AddRef() and _Release() as they are created and destroyed, so we have to make sure that all such variables are dead and gone before we free the object that they refer to, and this isn’t as easy as it may seem. Sadly, there is no way (that I know of) of creating variables holding references to interfaces in Delphi that do not behave this way. You will find the entire client definition in the file PerfMonClientDef.pas. It is dependent on the definition of the IPerfMonClientDef interface which I put in a separate unit for reasons already discussed. It’s also dependent on the WinPerf.pas unit so it can resolve the counter types which are defined there. The rest of WinPerf.pas is used only for the DLL when constructing the data blocks to send to Windows. The hairy stuff - WinPerf There’s one thing that’s not all that selfevident in this whole drama and that’s the data structure the DLL needs to hand back to Windows. Most everything about it is defined as structures in the winperf.h include file for C/C++, which I translated to Delphi and called “Winperf.pas”. The first thing to note is that all the structures (“records” in Delphi) need to be aligned on 8 byte boundaries. This is expressed in Delphi using the compiler directives “A8” or “A+”. Since this is the default, we don’t need to do that, but I’m telling you this so you don’t get the idea I forgot or that it would be fun to try another setting. I translated the whole header file, even though a lot of it isn’t used in my example, since it’s a pretty good documentation for these structures. The implementation of these structures as objects with methods can be found in the unit PerfCounters.pas. Both WinPerf.pas and PerfCounters.pas are reusable units, so you should drop them in your personal library folder and refer to them from there. More hairy stuff - PerfCounters The PerfCounters.pas unit contains the classes that wrap the structures from WinPerf.pas. When my DLL gets a call from Windows to deliver counter data, Windows provides a buffer to stuff the definitions and values of that data into. The structure Windows expects is composed of the following parts, all sequentially laid out in the same block:
According to the documentation, Windows lets you know which counters to provide, or if you’re supposed to provide all of them, but according to my tests on Windows XP, this seems not to be the case. I got one call for all counters, then all subsequent calls were for just one of them plus a few my DLL didn’t declare at all. Trial and error showed that always providing all counter definitions and values seems to work, so that’s what I do. I don’t think this can cause any performance problems as long as the number of counters is reasonable. In the PerfCounters.pas unit, there are the following classes:
When the DLL gets a call to the PerfData_Collect() function, it passes the buffer it got from Windows to TPerfCounters.Collect(). This function first adds in the global definition structure data, then calls each of the TPerfCounter objects to add their data definition structures behind it in the data block (using the CollectDefinition() procedure). After that, it again calls all TPerfCounter objects using the CollectCounterValue() procedure in the same order to have them add the current values of their counters. Doing things like this ensures the layout of the returned buffer will be as Windows wants it to be. Installation For Windows to realize that your application exports performance counters and that it has a DLL to supply them, some registry entries have to be added and others modified. The ones you have to add are located under: \HKLM\SYSTEM\CurrentControlSet\Services\YourApp\Performance Here you have to add the following string values yourself:
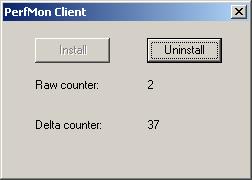
These registry entries are set in the PerfMonLib.pas unit, using values retrieved from the PerfMonClientDef.pas unit. I’m using the presence of the \Performance subkey to indicate that the performance counters are installed for the application, so I remove that subkey when uninstalling. That was the easy part. The hard part is updating the contents of the string values under: \HKLM\SOFTWARE\Microsoft\Windows NT\CurrentVersion\Perflib\009 This subkey has some really weird things going on. There are just two multistring valued entries: “Counter” and “Help”. Each contain all entries for all application on the system that export performance counters. It sounds sick and it is. The “Counter” value contains even-numbered lines, each holding a label representing an an application or a counter in an application, while the “Help” value contains odd-numbered lines with the corresponding “Help” strings. These are the strings you can see when you click the “Explain” button in Windows’ Performance Monitor. Were you to add these entries yourself, you would have to consider minimum and maximum values you can use. Were you to remove them yourself, you’d have to consider even more strange things. It seems to me to be a baroque system very prone to “fragmentation” of the consecutive number space and to plainly running out of numbers if you’ve got enough applications exporting performance counters. Hmmm…. maybe Microsoft made implementing performance counting so hard to avoid this problem? To make the editing of these two values easier (and, no doubt, to keep you from screwing up the strings), Microsoft provides two commandline utilities with Windows: lodctr and unlodctr. You find these in the system32 folder under your Windows folder. lodctr takes as parameter the name of an ini file containing the names and help strings for your counters and updates the registry accordingly. unlodctr takes the “driver” name and removes the corresponding entries from the registry. The “driver” name identifies your application and you choose it yourself. In my applications, it’s one of the strings defined in the PerfMonClientDef.pas unit. Having to run commandline utilities that utilize text files doesn’t sound all that appetizing. Luckily, Windows has two API function with the same functionality as those two utilities and it’s anyones guess if the API calls the utility or the other way around. Anyway, the API functions are called LoadPerfCounterTextStrings() and UnloadPerfCounterTextStrings() and reside in the loadperf.dll library. They are prototyped and called from the PerfMonLib.pas unit in the sample application. Since the sample first creates the ini file and its companion header file and then calls the LoadPerfCounterTextStrings() API function, all installation activity is entirely encapsulated in the application itself and not dependent on any other files. You only need to deliver two things to export the performance counters: the application executable and the performance counting DLL. The sample application The sample application I made especially for your pleasure has only two counters; one “raw” counter and one “delta” counter. Place the PerfMonClient.exe and the PerfMonDLL.dll files in the same directory, start the client program and click the “Install” button.
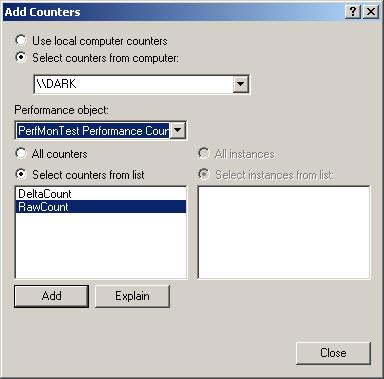
Then, if you’re using Windows XP Pro, open Control Panel ŕ Administrative Tools ŕ Performance. Up pops a graphical display with a few counters already running. Right-click on the graph itself, choose “Add counters…” and then in the dropdown box called “Performance object” select “PerfMon Test Performance Counters”. If you don’t see them, you either did not click the “Install” button in the client yet, or you’ve got a problem. Check the event viewer for errors if so. Once you’ve selected “PerfMon Test Performance Counters”, you should see two counters in the list: “DeltaCount” and “RawCount” as in the following screen shot.
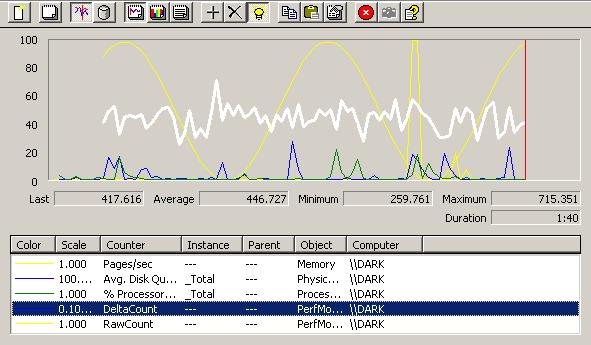
Now select the “All counters” radio button, then click “Add”. You can also click the “Explain” button to see the help text you configured in the PerfMonClientDef.pas unit. (A little weirdness: I can find no way to see the help text configured for the program as a whole, that is, the text in the constant cMAINHELP in PerfMonClientDef.pas. But, of course, I may have missed something.) After closing the dialog box you should see a graph similar to the following:
You can highlight the currently selected counter as I did by clicking the button with the lamp on it in the toolbar. The two counters we created are shown in the two last lines in the listbox. One is the heavy white line (DeltaCount) and the other is the yellow sinus wave in the graph above. Note that the Performance Monitor by default also adds in three counters most people want to see anyway, but I didn’t do anything either in my application or in the settings of Performance Monitor to make them appear. You should experiment with Performance Monitor to see what you can do with it, and there’s a lot to discover. There’s an entire system for logging the data to disk files also, but I’ll leave that to you to find out. Each counter can be scaled by right-clicking the row and changing the “scale” factor. But to make it easier on the user, you should predefine a suitable scale in your definitions and as you can see, the “-1” value in PerfMonClientDef.pas for the DeltaCount counter made it appear with a default scale factor of 0.1. Perfect. Well, that's it for today folks. Enjoy the evening.
|
||||||||
| TOP |